
The Performance Mode in canvas rendering for Line and Area charts (excluding baseline and variance lines). This feature has been designed to deliver smoother interactions, faster visual load times, and reduced rendering strain, especially when working with high-volume analytical charts.
Visualizing large datasets can strain rendering engines, leading to slow loading dashboards and delayed user experiences. Performance Mode eases this by restructuring, rendering logic to boost response while retaining core chart functionality.
Implemented exclusively in Line/Area chart types, Performance Mode helps:
Improve chart loading speed.
Maintain smoother scroll and zoom interactions.
Reset certain chart configuration behaviors to ensure optimal performance.
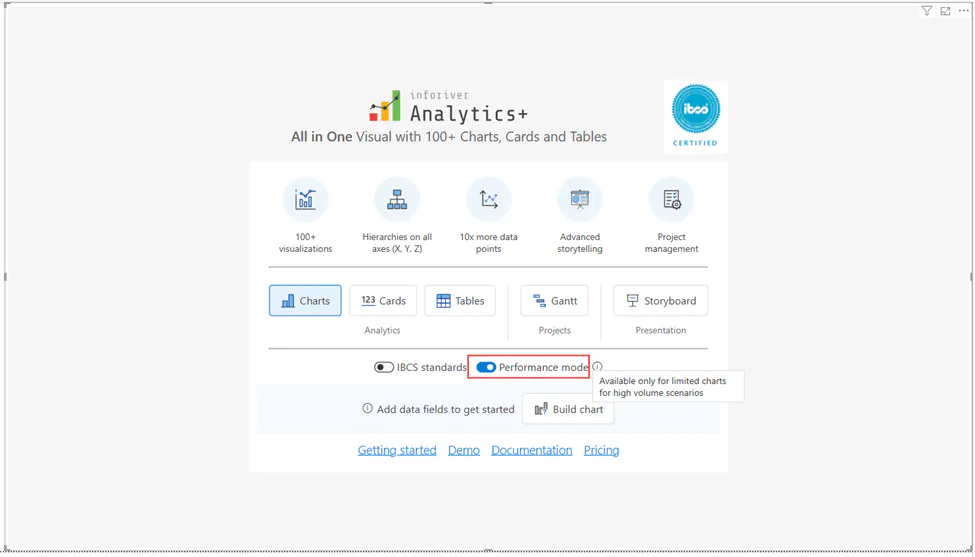
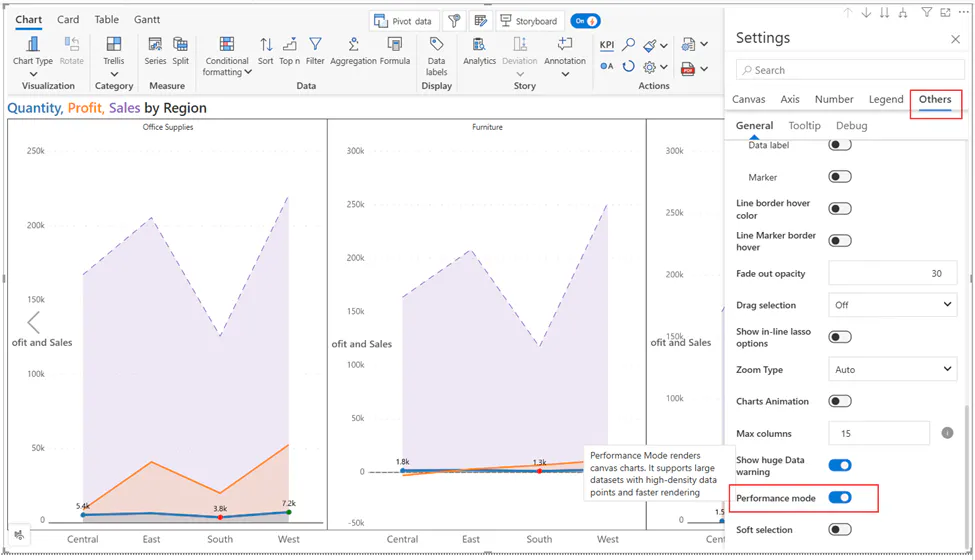
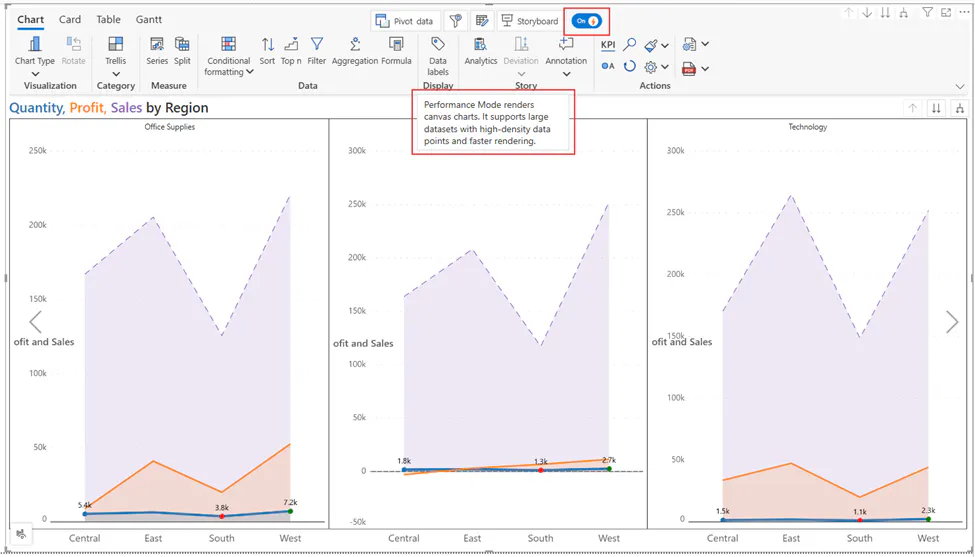
Performance Mode toggles are available in three key locations for supported chart types:
Landing Page
Others Tab
Toolbar
Default Behavior in Performance Mode:
Feature
Normal Mode
Performance Mode
Top N
Enabled
Disabled
Sorting
Native
Optimized
Scroll
Manual
Disabled
Multi-Chart Changes
Persistent
Reset on entry
Note:
Axis break functionality is not supported in Performance Mode.
Axis rankings configured in Normal Mode will not carry over when switching to Performance Mode but vice versa is supported.
For more details, check out the doc page: Performance mode.
FAQs:
Which chart types of support Performance Mode?
Currently, only Line and Area charts (excluding baseline and variance line types) are supported.
Does Performance Mode affect chart styling or layout?
Some settings like multi-chart layout and axis ranking may reset. Styling remains mostly consistent.