
We can filter charts in Inforiver Analytics+ using the Legend values. This is very useful especially if we want to visually filter using the Legend values.
Let us understand with an example.
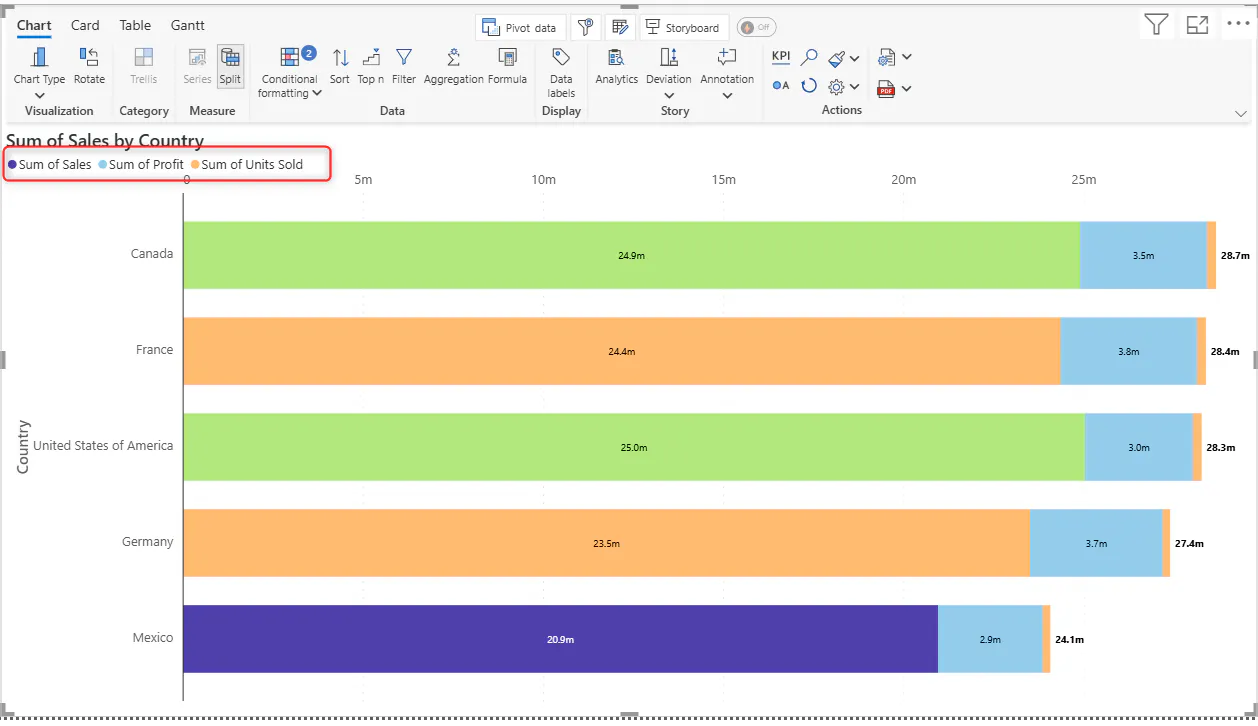
In the below chart we have three Legend values:
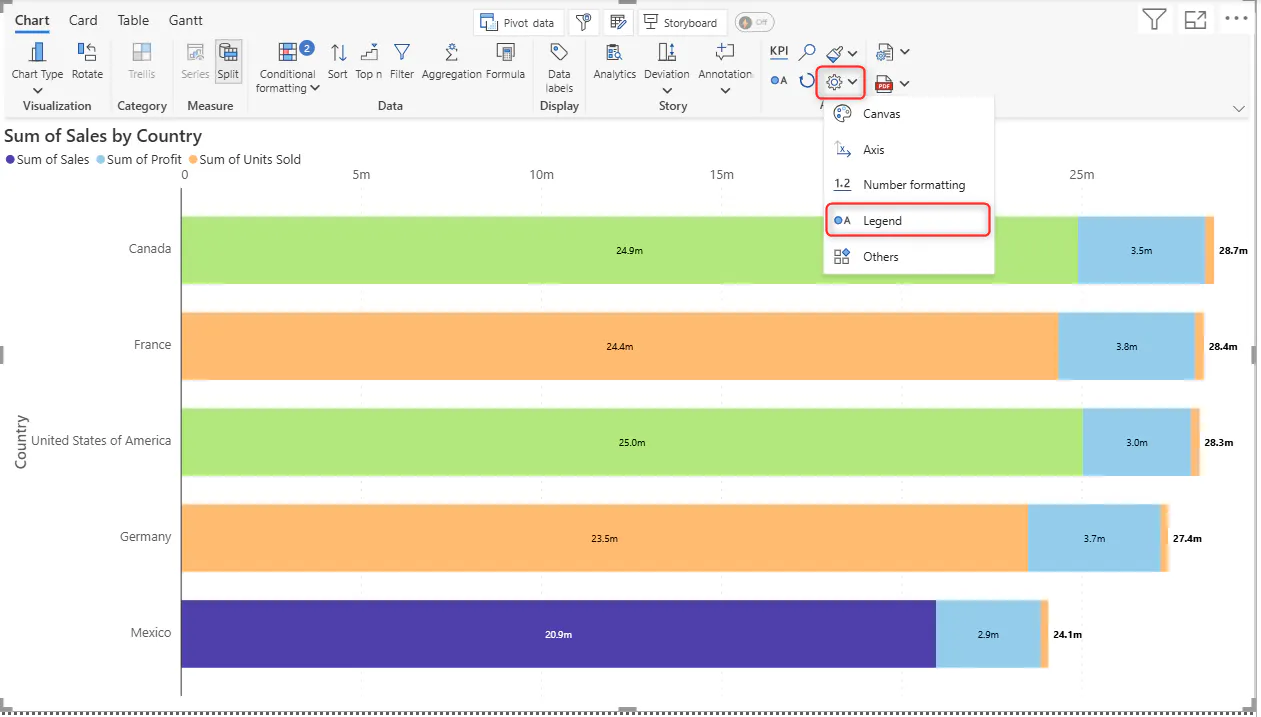
1) First, we go to Settings -> Legend as shown below:
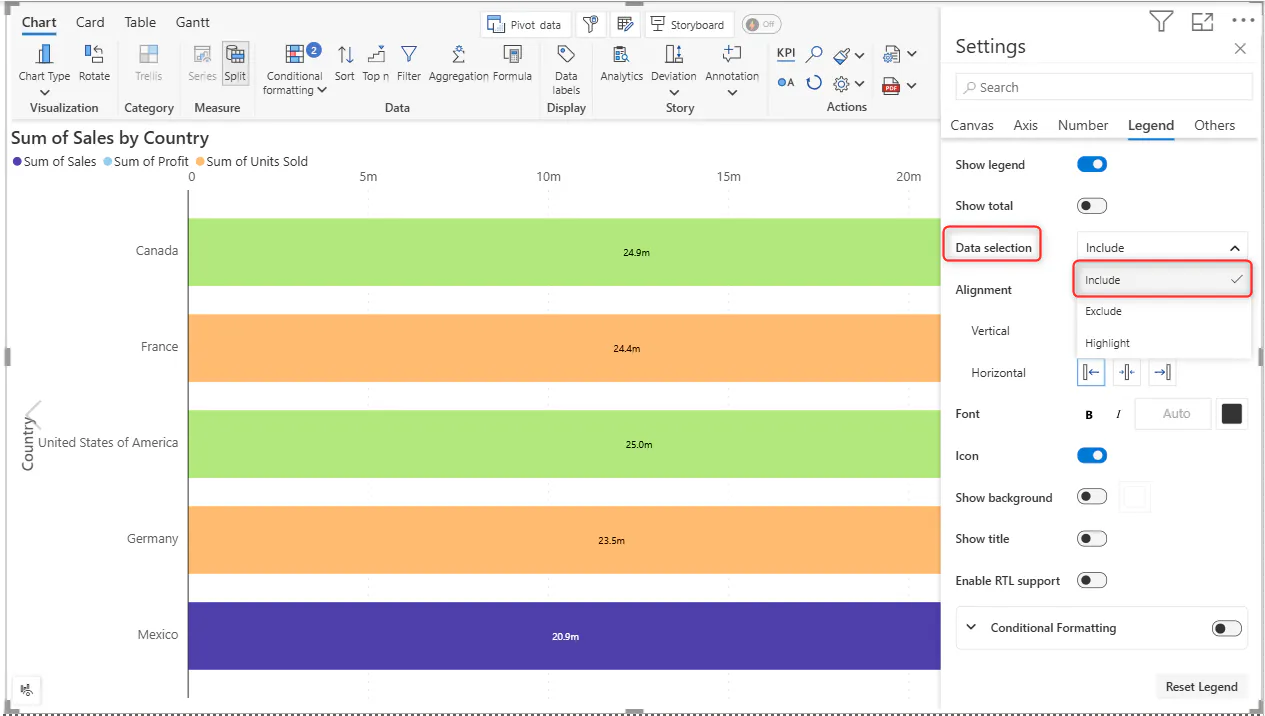
2) Under Legend we can go to Data selection and under the dropdown we can select the 'Include' option:
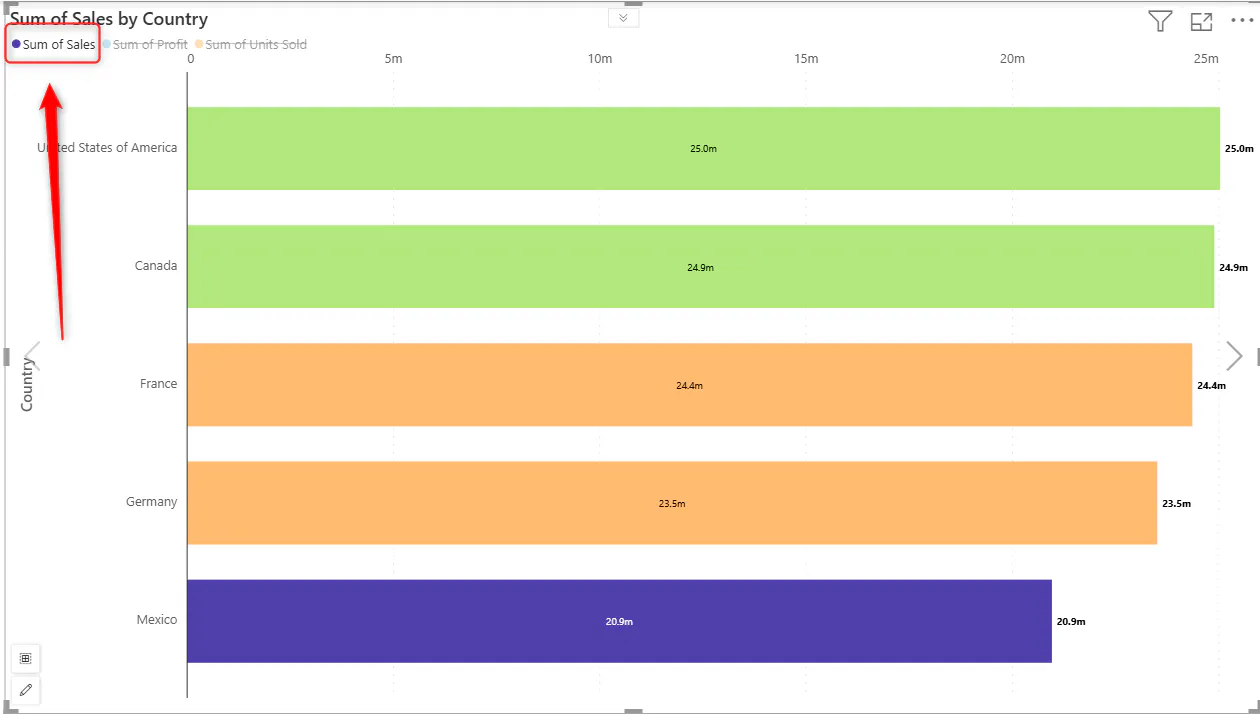
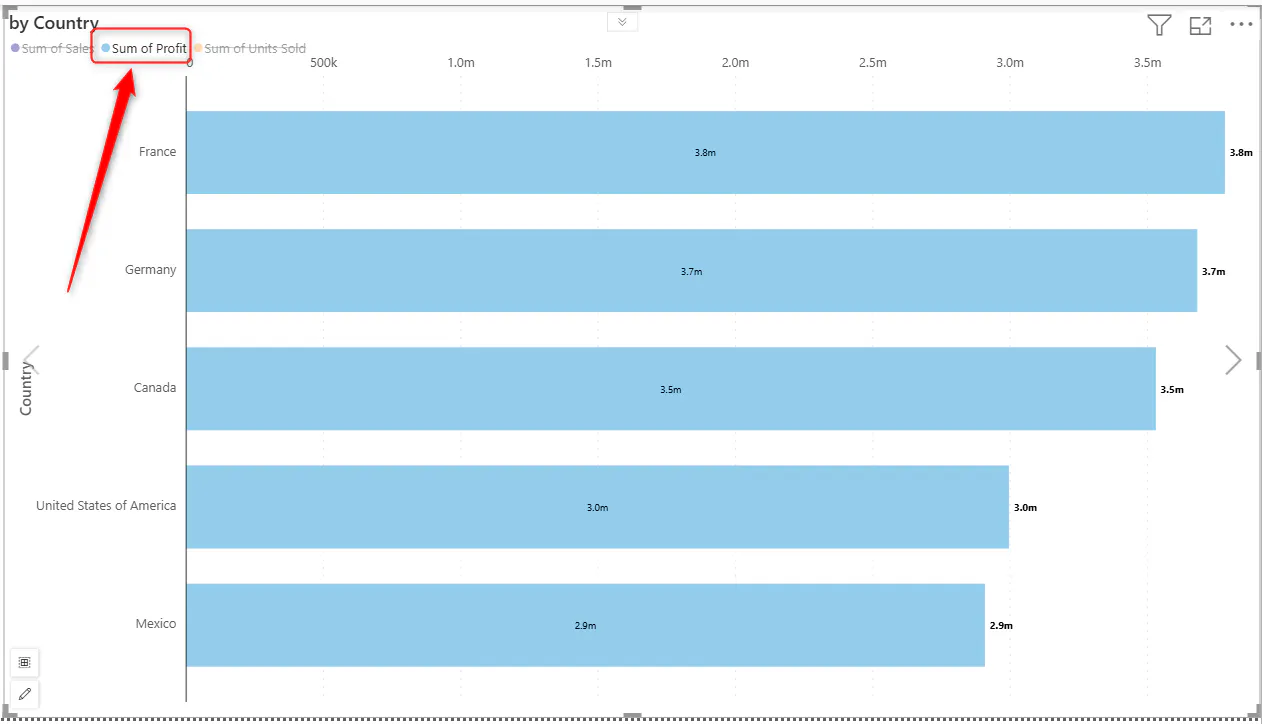
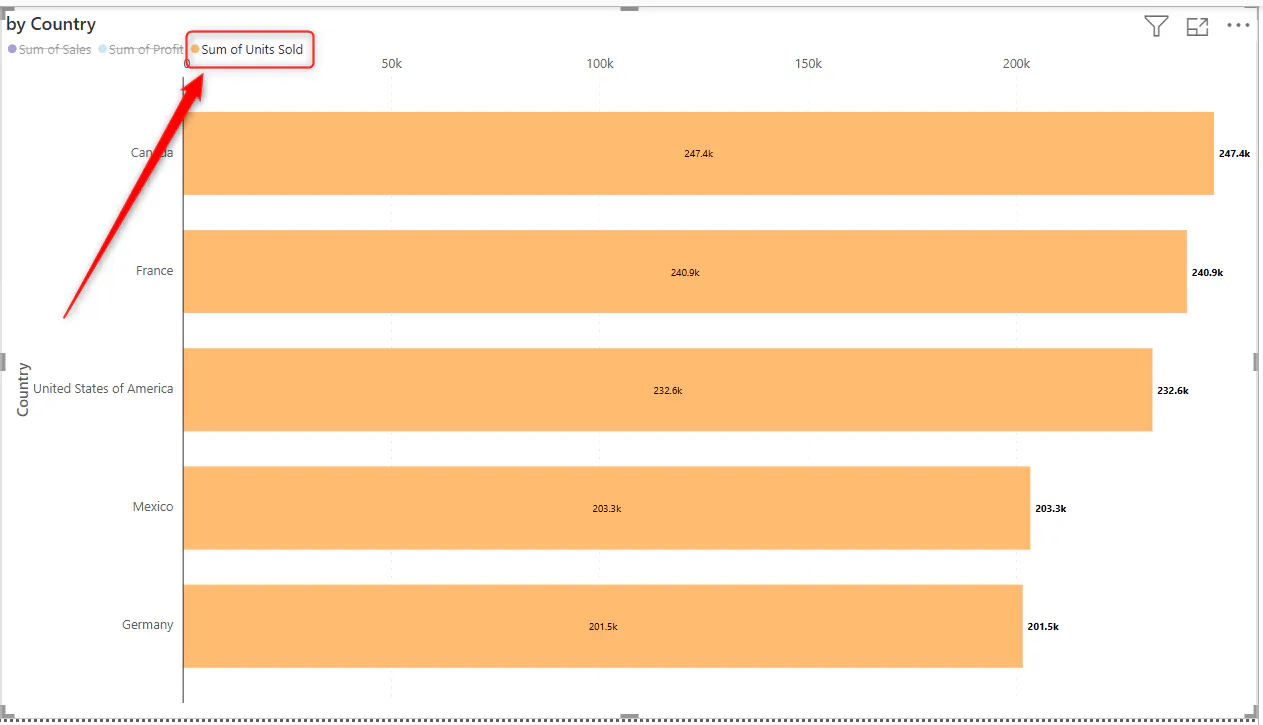
3) Now we can go to Reading View in Power BI Service and test this out (this feature only works in Reading View and does not work in Edit Mode):
FAQS:
Can we Filter by Legend values in Edit Mode?
No, we cannot filter by Legend values in Edit Mode in PBI Service. It only works in Reading View in PBI Service.
Can we Filter by Legend values in Power BI Desktop?
No, we cannot. It only works in Reading View in PBI Service.