


One of the most salient features of report building is the use of calculated columns/measures. It usually involves the manipulation of existing values in the visual to create new values which can be represented as either calculated columns or measures.
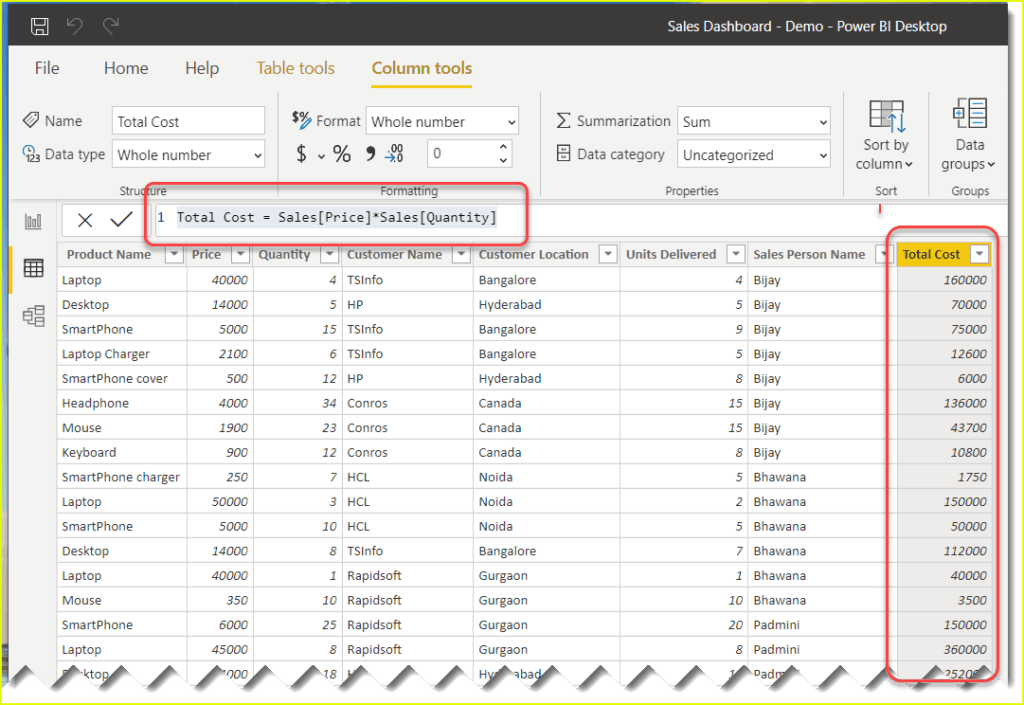
In Power BI we can create Calculated Columns/Measures by clicking on either the New column option or New measure option:
Similarly, we can achieve Calculated Columns in Excel through the use of either Formula or the Pivot Table:

However, in both Power BI and MS Excel we cannot refer to specific individual values within the Table/Matrix when creating a Calculated Column/Measure.
For example, in Power BI when creating a Calculated Column, we cannot refer to the values within the Table/Matrix and end up getting an error like shown below:


This however can be achieved in Inforiver Matrix through the use of the Insert Formula feature.
Let us illustrate this with an example.
1) Say we have a sample report like below:

2) We can go to Insert tab -> Select Insert Formula and a tab will open up in the right side:

3) Now we can choose either Visual Column or Visual Measure. If we have multiple column hierarchies, then we can use the Visual Measure option and a column will automatically populate in each hierarchy. Otherwise by default we will get the Visual Column option:
Visual Column:

Visual Measure:

4) In our example we will use the Visual Column option. Let us write a sample formula just to show how it works. In the below example I am multiplying the Sales into Units Sold to create a Calculated Column:

5) We can also refer to specific individual values within the Matrix. For example, let us say we only want to see the Units Sold for France. We can simply use the Visual Measure to accomplish this as shown below:
Note: This can only be done in Visual Measure.


6) Once we finish selecting our values we can then simply click Create and the Formula will be updated:
